Publications > Article
Areas of global importance for conserving terrestrial biodiversity, carbon and water
To meet the ambitious objectives of biodiversity and climate conventions, the international community requires clarity on how these objectives can be operationalized spatially and how multiple targets can be pursued concurrently. To support goal setting and the implementation of international strategies and action plans, spatial guidance is needed to identify which land areas have the potential to generate the greatest synergies between conserving biodiversity and nature’s contributions to people.
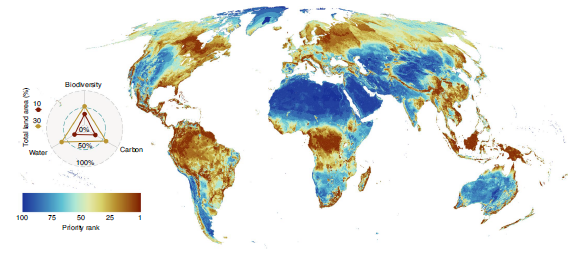
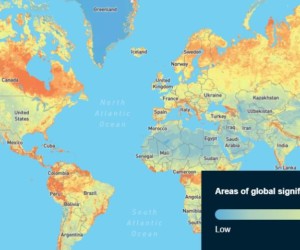
Bernardo Strassburg, IIS executive director, is coauthor of a paper published in Nature Ecology & Evolution journal that presents results from a joint optimization that minimizes the number of threatened species, maximizes carbon retention and water quality regulation, and ranks terrestrial conservation priorities globally. They found that selecting the top-ranked 30% and 50% of terrestrial land area would conserve respectively 60.7% and 85.3% of the estimated total carbon stock and 66% and 89.8% of all clean water, in addition to meeting conservation targets for 57.9% and 79% of all species considered.
The data and prioritization further suggest that adequately conserving all species considered (vertebrates and plants) would require giving conservation attention to ~70% of the terrestrial land surface. If priority was given to biodiversity only, managing 30% of optimally located land area for conservation may be sufficient to meet conservation targets for 81.3% of the terrestrial plant and vertebrate species considered.
The results provide a global assessment of where land could be optimally managed for conservation. Finally, they discuss how such a spatial prioritization framework can support the implementation of the biodiversity and climate conventions.
